Like baseball junkies, Lego investors also use statistics to estimate the future performance of their investment sets. Among these, the **Price Per Piece **statistic seems to have caught on as the default metric to assess the "value" of a set. PPP shows up prominently in Brickpicker's very own set review template, asking reviewers to assess the set's PPP for a better understand of the set's value. Its concept is simple: the more bricks a buyer receives for their dollar, the more they "get" for their money. Typically, buyers and investors have used a $.10 per piece benchmark to label sets as good or bad values.
In the context of investing, using PPP to estimate future demand for a given set is at best limiting, and at worst, flat out wrong. In order for PPP to help in measuring future performance, we need to see a correlation between PPP and secondary market performance. Unfortunately, there are hundreds of examples where low Price Per Piece sets don't perform well after retirement, and a similar count of high PPP sets that are phenomenal performers. In my earlier blog, Lego Truths and Myths, I showed how 5525 Amusement Park has a strong PPP ratio of $.052/piece and a dreadful secondary market performance, with a 32% loss from MSRP. Yet in the same theme, 10183 Hobby Trains has a PPP of $.093, with an amazing 135% incredible secondary market gain, while 5526 Skyline has a ridiculously low PPP of $.047 with an even better 144% post-EOL yield. As you can see, there is no correlation between low PPP and high earnings within the Factory theme.
For other themes, the trend continues: here is the performance of a recent, relevant theme, Pirates of the Carribean:
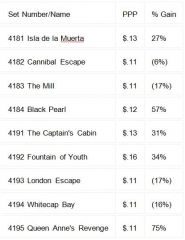
For a theme with some pretty similar PPPs, there is a huge difference in post-EOL performance. The takeaway is this: there is NO correlation between PPP and secondary market performance. Demand for a secondary market set is largely determined by other set characteristics, most notably primary market demand and primary market availability. So can PPP be used for anything, or is it a complete strikeout for investors? To answer this, we must determine whether there are secondary market buyers that are price-sensitive, or more willing to buy something if it's priced lower. Here is a simple market segmentation showing the types of secondary market buyers that I presented in a previous blog article:
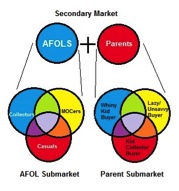
Among the secondary market's two submarkets of AFOLs and parents, there is one market segment that is very price conscious: MOCers. MOCers are AFOLs (Adult Fans of Lego) that design and build their own models referred to as "MOCs", an abbreviation for "My Own Creations". They often require specific colors or unique pieces for their MOCs and will pay what they need to get them. However if there are cheaper, more reliable alternatives, they will use them. In the past, a few bold expert investors have tried to purchase retail sets anticipating the set's pieces will be more desirable than others after the set has retired. To find these sets, most use Bricklink.com, a website with a function that provides the total part-out value of a set based upon the last six months of sales, so comparing the retail PPP against the part-out PPP may provide investors with a good gauge to whether MOCers might pay inflated prices once a set has retired. Here are some randomly selected retail sets with their current part out and retail PPPs:
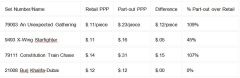
This table shows us that MOCers would likely pay a premium over retail for 79003 and 79111, but NOT for 9493 and 21008 since their Part out to Retail PPP ratio is significantly lower. Technically, this is a metric that can be calculated without PPP, but translating it to PPP allows meaningful comparison across all types and sizes of sets. When using this new metric, it's important to bear in mind that this Part-out to Retail PPP ratio isn't an assessment of future secondary market performance, only a guess whether MOCers will still purchase sets above retail after retirement. While Burj Khalifa has a terrible ratio, it still may be a winner in the secondary market because of its collectability as part of the Architecture theme. While the Part-out to Retail PPP ratio allows us to think about PPP and investing from a slightly different angle, it will likely never become a meaningful or widely used statistic since it only measures demand from one small segment of the overall secondary market.
There are two other insights from PPP that provide additional information to our beloved Lego universe:
On average, licensed themes are more expensive on a Price-Per-Piece basis than non-licensed themes. Comparing the average theme PPP among a group of licensed themes could provide a very rough comparison of Lego's licensing costs. We surmise that Star Wars has the highest licensing fees because their sets' PPPs are, on average, higher than others. Comparing the aggregate PPP for a theme would likely show this even better.
The PPP ratio can also be used by Lego buyers to quickly expand their Lego piece collections by purchasing only low PPP sets. This would apply to a VERY small segment of Lego buyers with a negligible effect on either the primary or secondary market.
While these PPP fun facts are interesting, they aren't particularly illuminating for investors.
We know from our assessment of PPP that there is no correlation between PPP and investment success. Yet, while the best analysis in the world can give you a great chance at making money, the immortal words of Yogi Berra still echo loudly in the relatively immature Lego investment market:
"In theory there is no difference between theory and practice. In practice there is."
If you are determined to use Price Per Piece as part of a systematic approach to investing, you can still make money. As always, invest accordingly.